Try the Top Performing Candlestick Pattern Scanner FREE
NO CREDIT CARD REQUIRED
What if you could close every chart on your screen and delete every squiggly indicator line…
What if you could tune out every trend line, RSI reading and MACD crossover, ALL of it…
And you still had the chance to turn a dirt-cheap call option into what could be a massive payday?
Like this 108% winner over the 4th of July:
Or this 133% winner overnight:
Or how about this one using the same pattern. It took a bit longer over 5 candles but nailed a 200% winner.
I know this might sound CRAZY, maybe even a little too good to be true…
But we have several million data points to back it up.
These returns weren't a fluke either.
In fact, on just this ONE pattern, we see SPY and QQQ move in our favor over 70% of the time.
And, even better, about 25% of the time, those moves go on to generate TRIPLE DIGIT gains!
We built the most powerful scanner we've ever created specifically to target these high conviction patterns.
And, ON THIS PAGE ONLY, you will get a chance to try it for FREE.
Not even a credit card required.
The scanner does the hunting for you
It's all thanks to a custom-coded scanner that checks the 100+ largest stocks and ETFs every single evening.
It spots which specific ones are primed to deliver a double or triple-digit play.
And it automatically pulls only the tickers where this pattern has historically worked on that SAME ticker.
You can see it right on the scanner. Here's Walmart, one of the tickers it pulled:

And our scanner runs through the data on EVERY ticker in our universe to ONLY show the ones with a proven track record in their own history.
The way it works is really simple.
All you have to do is wait for the scanner to flag a setup for you, in the evening, after the close.
And if you like what you see, you can click a few buttons in your brokerage account the next day to follow along…
Then you have the chance to walk away with a double or triple-digit payday in a matter of DAYS, not weeks or months!
A 72% winner on SPY in one week
For example, look at what happened on SPY, which tracks the S&P 500, in October 2024.
SPY had climbed all the way back from its sharp drop in early August, and then it slipped about 1% in the first three days of October.
On Friday, October 4th, SPY printed the pattern this scanner hunts for.
The sellers pushed it down during the day, and the buyers pushed it right back up by the close, on lighter trading than usual.
That meant SPY could be primed for a big move, and here's how the scanner showed it that evening:
Anyone who bought the call on Monday was up 72% on it by Friday, the fifth day.
That's like watching $1,000 turn into more than $1,700 before the weekend even started…
You see, most people try to make their trading as complicated as possible.
With this scanner, it's one pattern and one call, and the whole trade is over inside a single trading week.
Five winners in three trading days
For example, on Thursday, May 2nd, 2024, the scanner flagged QQQ. Five days later, that call was up over 30%…
That same evening, it flagged SPY too, and five days later that call was up 70%…
This was a rare opportunity where BOTH SPY and QQQ flagged the same day and BOTH had juicy winners.
Then the very next evening, it flagged Lockheed Martin (LMT), for an 89% winner five days later…
That same Friday, it flagged Walmart (WMT) too, for a 62% winner…
And how about Monday, May 6th, when it lit up JPMorgan (JPM), for a 300% winner by the fifth day…
Put $1k into each of those, and you'd be sitting at over $5k in profits a week later!
And every one of these would have happened with the SAME pattern that our scanner flags every evening after the close.
Each example is based on a basic call option using simple rules that we'll teach you.
And remember, you can try this scanner for FREE, right here on this page, and there's not even a credit card required.
The one pattern behind every example on this page
It's all thanks to a phenomenon that has come right before some of the sharpest bounces in some of the biggest names in the market, and I like to call it a "Sold Out" day.
Now, candlestick patterns like this one are so revealing that traders have been reading them since the rice markets of 1700s Japan…
But I'd bet most chart-watchers have never once counted a Sold Out day…
That's because it's buried inside three things that all have to line up on the same day, and they're practically impossible to check by eye on every chart, every single night.
Yet, when it triggers on SPY and QQQ, the following week averages a 4X more positive move than the average week in that same asset! (that's insane)
So we built a scanner that flags these Sold Out days for you every evening, after the close.
UnitedHealth: left for dead, then 33% in five days
For example, take a look at UnitedHealth (UNH) back in June 2025.
After its earnings report in April, the stock cratered more than 22% in a single day, and a month later it lost almost 18% more in another single session.
By June it was sitting more than half below its high, stuck in a narrow range with no signs of life.
Then on Monday, June 23rd, UnitedHealth printed a Sold Out day.
The sellers knocked it more than 2% lower during the day, and the buyers took most of it back by the close, on lighter trading than usual.
The scanner would have shown it, too, because on UnitedHealth's own last ten years this pattern had been followed by a higher week more than six times in ten:
If you'd bought the call the next day, it slipped for two days, and then UnitedHealth started to climb…
By the fifth day, the call was up 33%, on a move of just 3.5% in the stock itself.
On a $2,500 stake, that's more than $800 in five days.
Micron: a 283% winner in five days
It was the same story with Micron (MU) in the winter of 2022…
Micron had lost nearly half its value in a single year, and almost 15% in the five weeks before Christmas alone.
And 2022 was on its way to being the stock market's worst year since 2008, so anyone looking at that chart would have stayed far away…
But on Tuesday, December 27th, Micron printed a Sold Out day right at the close.
At its worst that day it was down more than 3% from Friday's close, and by the final bell the buyers had taken back almost all of it:
For the first three days the stock went nowhere, and by Friday the call was even down a quarter…
Then on the first Wednesday of the new year, Micron took off like a rocket, and within five trading days the call was up 283%.
So even in the worst year for stocks since 2008, you didn't have to sit on your hands.
Let me stop right there for a second…
Put $1k into each of those two, and you'd be sitting at nearly $3,000 in profits!
We all know life has gotten pricey, with groceries, rent, insurance and gas adding up month after month.
Money like that makes a nice little cushion for the slush fund.
I love finding setups like those, and giving people a real shot at making some extra cash, even when the market looks shaky.
And I want to make it even easier for you, by handing you access to the fully automated Candlestick Pattern Scanner at ZERO cost today.
SPY and QQQ closed higher more than 70% of the time, with 4X the usual move
Now, no strategy wins 100% of the time, so never invest more than you can afford to lose.
But here's what the numbers show…
On SPY and QQQ, we see the ticker close higher more than 70% of the time after the pattern is flagged.
And, again, not just higher but about 4X the average move for that very same ticker.
In other words, when we say this pattern works, we mean it!
Why buying the dip keeps burning you
You see, if you've been trading for a while, you've probably bought the dip, only to watch it keep right on dipping…
It feels like you keep climbing up the stairs just to take the elevator back down…
Well, don't beat yourself up. Most traders are taught to lean on indicators, fundamentals and trend lines, and then guess when the selling is finally over.
But none of those can actually tell you the sellers have run out, because an RSI under 30, or a stock touching the bottom Bollinger Band, does NOT mean the last seller has sold.
A Sold Out day does. When one pops up on the scanner, the pattern itself is showing you the sellers took their best shot and ran out, right there on the chart.
Apple: every indicator said stay away, then a 60% winner in five days
For example, let's look at Apple (AAPL) back in April 2023.
Apple had spent a full year going nowhere, and that Monday it closed almost exactly where it had closed twelve months before.
Toss your favorite indicators on the chart and there was NO clear signal: the RSI sat at 59, the price sat between the Bollinger Bands, and the Stochastics had crossed down.
But on Monday, April 24th, Apple printed a Sold Out day right at the close, and the scanner flagged it:
If you'd bought on Tuesday, Wednesday was rough, and the call was down 24%…
Then Apple turned, and by the fifth day the call was up 60%, on a stock every indicator said to leave alone.
From 133% overnight to 316% in five days
Remember that 133% winner overnight at the top of this page? Here's the rest of that story.
SPY dropped more than 8% from mid-July to early August, climbed almost all the way back by late August, and then slipped again in early September.
On Tuesday, September 10th, 2024, SPY printed a Sold Out day right at the close.
If you'd bought on Wednesday, the very next day SPY closed almost 2% above Wednesday's open, and the call was up 133%.
And if you'd simply held it to the fifth day, the rule's own exit, it was up 316%!
Okay, let me pause right here again…
Put $1k into that Apple call and $1k into this SPY one, and you'd be sitting on more than $3,600 in profits!
That's more than $1,800 a week for the two weeks your money was in the market, a better week's pay than most folks take home.
The day the sellers throw everything and still lose
So you're probably wondering why the buyers show up right after one of these days?
Well, when I say "the sellers ran out," I am NOT talking about a hunch.
The proof is right there on the chart, because every trading day the buyers and the sellers fight it out, and the pattern the day leaves behind shows who won.
We're looking for one kind of day: the day the sellers threw everything they had at a stock that was already sliding, and still LOST.
TJX: eight dead weeks, then a 29% winner
For example, take TJX (TJX), the company behind T.J. Maxx and Marshalls, in August 2024…
The stock had been stuck in a sideways rut for about eight weeks, never moving more than 7% from top to bottom.
Then on Monday, August 12th, right at the close, TJX printed a Sold Out day:
After a scare on Wednesday, by the fifth day the call was up 29%, on a stock that moved just over 1%.
RTX: a 217% winner in five days
And it was no different with RTX (RTX), the defense company behind Raytheon, last December…
For most of 2025, RTX was a pretty great stock, up more than 45% on the year.
But heading into December it had slipped more than 4% from its October high, including a drop of almost 4% on December 1st alone.
Then on Friday, December 5th, RTX printed a Sold Out day, on 22% less trading than usual:
By Friday, the fifth day, the call was up 217%, while RTX itself had risen just over 4%!
Bank of America: a 484% winner in five days
And I can show you dozens more examples just like this, like Bank of America (BAC) in November 2023…
Bank of America had just jumped almost 13% in a single week off its late-October low, and then it slipped four days in a row.
Then on Friday, November 10th, it printed a Sold Out day, on 41% less trading than a usual day:
By Tuesday the stock was up 6%, and the call was up a mega 245%!!
And if you'd simply held it to the fifth day, it was up 484%, so $1k would have made $4,800 in profits by Friday!
Now remember, folks, like any strategy there are bound to be winners and losers, so never risk more than you could afford to lose.
Luckily, you don't need to tie up a whole bunch of cash, because the typical call the scanner would have shown has cost a little over $200 for one contract.
Take that Bank of America call: 100 shares of the stock cost about $2,750 that Monday, and the call on those same 100 shares cost $33.
Once the last seller gives up, the bounce can come fast
Now here's where things get interesting…
When a stock slides day after day, everyone holding it sits on a bigger and bigger loss.
If a crowd bought a million shares at $100, they're down $10 million at $90, and $20 million at $80.
Sooner or later they run out of patience and sell at any price, just to make the pain stop.
And once the last of them has sold, there's hardly anybody left to sell to the buyers waiting on the sidelines, so the bounce can come fast.
You could see it at the end of 2008: SPY fell more than 40% in under three months, then spent all of December stuck about 30% down, and just about everyone was ready to throw in the towel:
On Monday, December 29th, in the quiet days between Christmas and New Year's, SPY printed a Sold Out day, and over the next five trading days it climbed more than 7%.
On the chart, that moment has one very specific look: the sellers push the price well down during the day, and by the close the buyers have pushed it right back up.
That leaves a long tail hanging under a small body, the shape traders call a hammer.
We want it right after a down week, on a day with quieter trading than usual.
That quiet volume tells you hardly anybody was left to sell.
That's our Sold Out day, and the bounce that can come after it.
Citigroup: 76% in five days, in the middle of a bank panic
Let me show you another one: Citigroup (C) in March 2023.
Silicon Valley Bank had just failed, and over the previous three weeks Citigroup's shares had dropped almost 18%, including more than 7% in a single session.
Then on Friday, March 24th, Citigroup printed a Sold Out day, closing at the very top of the day on lighter trading than usual.
I didn't care where Citigroup would end up. All that mattered was that once that pattern printed, the sellers had run out:
If you'd bought the call on Monday, by Friday it was up 76%.
Alphabet: a quick 38% out of a sleepy chart
Here's one more, on Alphabet (GOOGL), the company behind Google, in June 2025.
It had been drifting inside a narrow band for a month, still almost 16% below its February high, the kind of chart most traders scroll right past.
But at the close on Thursday, June 26th, Alphabet printed exactly what the scanner hunts for:
If you'd bought the call on Friday, it would have bagged a quick 38% by the fifth day, the Thursday before the 4th of July.
Now, not every one of these worked out, and plenty of them lost money too…
But the winners ran much further than the losers fell: on the stocks, the average winner made more than 80%, while the average loser gave up a little over half of what it cost.
Three more quick winners
Like Union Pacific (UNP), the railroad, on Tuesday, February 20th, 2024, where the call was up 71% five days later…
Or SPY on Wednesday, October 2nd, 2024, on 19% less trading than usual, where the call was up 59% by the fifth day…
Or GE Aerospace (GE) just two days later, the very same evening as that 72% SPY winner I showed you earlier, up 45% by the next Friday.
$2,500 on every SPY and QQQ signal since 2022: more than $23,000 in profit
Now I'm not going to lie: some days, this feels like cheating!
All I'm really doing is waiting for one pattern to print after a slide, and then tagging along as the buyers step in.
Say you'd put up to $2,500 into the call on every Sold Out day SPY and QQQ printed since September 2022, winners and losers, without compounding a single penny…
You'd be up more than $23,000 in profit, and going up to $5,000 on each, more than $46,000.
Why I'm handing it to you FREE
Now with results like that, you might be wondering why on earth I'd hand out this scanner for FREE?!
Most so-called experts never give away their best tools, because the more people trade a strategy, the more likely they are to crowd out its edge.
But a Sold Out day is a pattern that has ALREADY printed, with the close already on the books, so the ten-thousandth person to see it gets the exact same setup as the first.
So sharing it costs me nothing, and the more of you see what it can do, the more of you will want to keep it.
That's why YOU can test-run the scanner for zero cost, starting today: Claim your free month.
Here's what you'll see when you open it
When you open the scanner in your members area, you'll see every pattern it flagged at the latest close, one row for each one. Here's what it showed at the close of Tuesday, January 27th:

The Walmart and Netflix rows are Sold Out days, listed under the name traders give the shape, "Hammer on quiet volume." The Apple row is one of the two extra patterns I'll show you further down. Each row tells you why the pattern counts and why it's showing on that ticker, and opens its own chart.
From there, as long as everything looks good to you, it's really point, click, trade.
Walmart: a 922% winner in five days
Like the Sold Out day on Walmart (WMT) at the top of that screen, the best one I've found.
Walmart wasn't in any kind of trouble: it hit its highest close in a year in the middle of the month, then slipped three days in a row, the kind of dip most people wouldn't even notice.
But on Tuesday, January 27th, Walmart printed a Sold Out day, and the scanner flagged it, because on Walmart's own last ten years this pattern had been followed by a higher week better than two times in three:
By Monday, the fourth day, the call was already up 327%…
And by Tuesday, the fifth day, it was up a MONSTER 922%, on a move of less than 10% in Walmart itself.
A modest $1,500 in that call would have booked more than $13,600 in profit, in one trade…
Imagine taking a few seconds to place a quick trade on your phone, then coming back one week later to an extra $13,600 sitting in the account!
And the very scanner that flagged it is YOURS to try for FREE, starting this week: Claim your free month.
The scanner checks every rule for you, every single evening
To make it onto your scanner, a pattern has to pass some very strict rules.
The stock has to be sliding, with the five trading days before it finishing lower.
The day has to leave a long tail underneath at least twice the size of the body, with the close in the top third of the day's range.
And the volume has to be quieter than that stock's usual day.
Your scanner checks every one of those rules for you after every close, so you never have to go hunting for one yourself.
The one simple rule behind every example
Every example on this page uses the most basic options trade there is: simply buying a call.
The strike is the first one listed at least 1% above that day's close.
The expiration is the first Friday at least ten days out that has contracts listed.
And the most it can ever cost you is what you paid for it, and not a penny more.
Your free month starts today
So here's what I'm going to do…
You get The Candlestick Pattern Scanner FREE for 30 days, with no credit card required.
Once your free month is up, the scanner is $297 a year, but today you can try every bit of it without paying a cent.
That includes every Sold Out day the scanner shows on the 100 largest US stocks and on SPY, QQQ and IWM over the next month.
And while the scanner does the hard work, my research letter comes with it, free, in your inbox every trading morning, with the thinking behind every idea in it.
And that's not all your scanner watches for.
Plus two more patterns, free
Your scanner flags two more patterns as well, and each one had to prove itself on SPY and QQQ, just like the Sold Out day, before it could show up anywhere.
The first is the inverted hammer on heavy volume: after a down week, the buyers push the price well up during the day, the sellers push it back down by the close, and more shares change hands than usual. When it triggers on SPY and QQQ, the following week has averaged more than 3X the move of an average week!

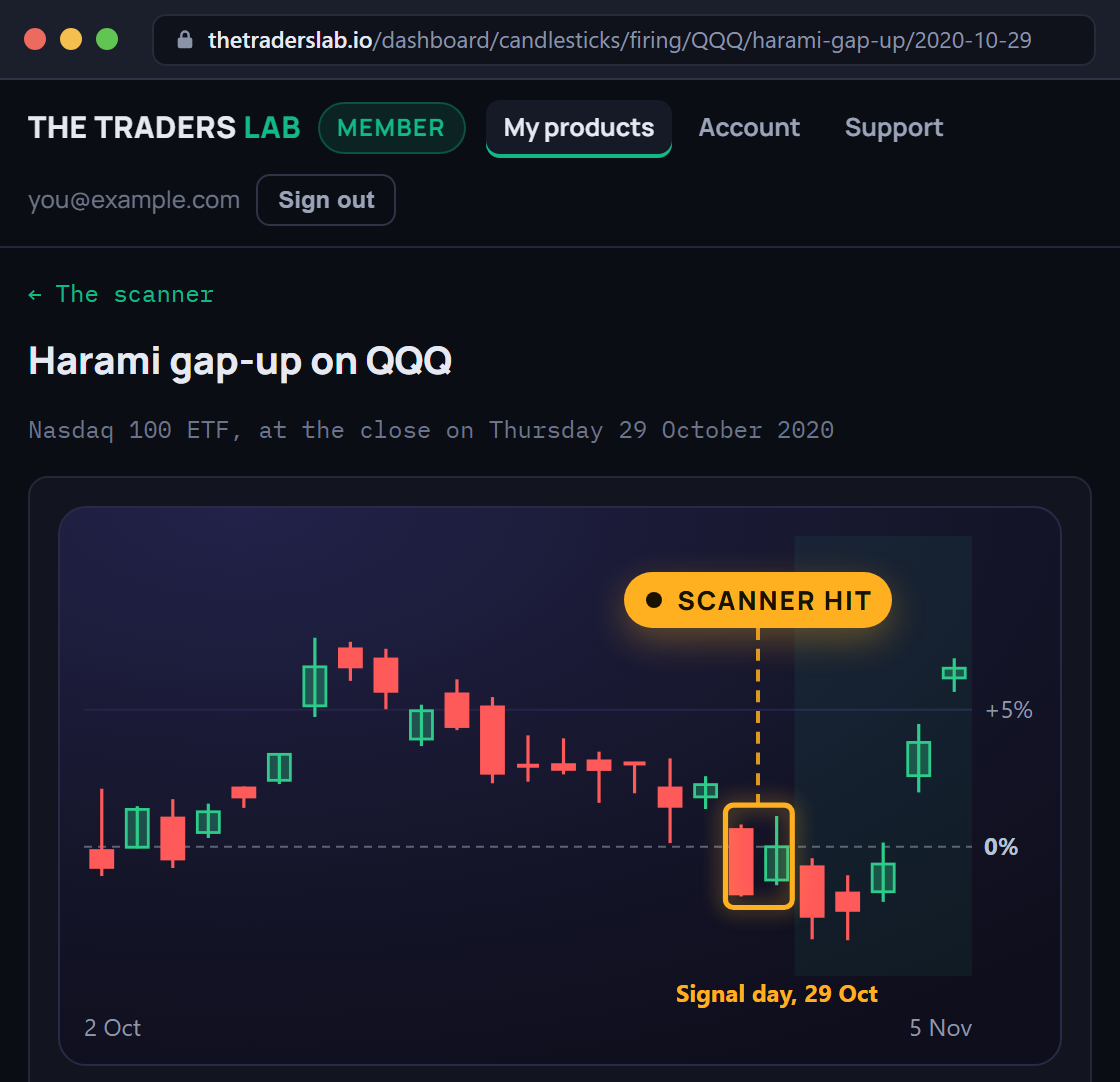
The second is the harami gap-up: after a down week, a big red day is followed by a small green one that opens above the red day's close and sits inside its body. When it triggers on SPY and QQQ, the following week has averaged more than 3X the move of an average week too.

All of it is yours free for the next 30 days, and with no card on file, there's nothing to cancel:

A full year for less than 82 cents a day
That $297 a year works out to less than $25 a month, or less than 82 cents a day, for every close on the 100 largest US stocks and on SPY, QQQ and IWM, checked for you every single evening.
Don't close the next page
But if you already know you'll want this scanner for the full year, you won't have to pay anything near $297.
Once you click the button below and your free month is locked in…
Do NOT close the next page.
On that next page, you can take the full year for just $97 instead of $297, and save $200 instantly.
You keep your free month on the house, so that's THIRTEEN full months of the scanner for one payment of $97, under $8 a month.
And I'll also lock your price at that same $97, every year after, for as long as you stay a member.
Everyone else pays $297 a year after their free month, which is THREE times as much, for the exact same scanner.
Just know that the $97 year is only available on that next page, so if you click away, you'll be left paying $297 down the road once your free month ends.
So click the button below, and claim your free access to the Candlestick Pattern Scanner today.
CLAIM YOUR FREE ACCESS TO THE CANDLESTICK PATTERN SCANNER
- FREE 30 Day Pass (No Credit Card)
- Annual Price: $297 Per Year
- Next Page Only: $97 For 13 Months, Rate LOCKED In!!
SPY and QQQ, one evening, both up 237%
Remember that SPY call from the very top of this page, the one over the 4th of July?
That Sold Out day printed right at the close on Monday, July 1st, 2024, and by Tuesday, the fifth day, the call had climbed 237%.
And QQQ printed one too, at that very same close…
By the fifth day, that QQQ call was up 237% too, so $1k in each would have made more than $4,700 in profits by that Tuesday!
No screen-watching, no day trading
You don't have to be glued to your computer, because the scanner only flags a Sold Out day once the market has closed and the pattern has fully printed, and it's sitting on your scanner that evening, on your computer, tablet or phone.
And you don't have to worry about the day-trading rules either, because the call is bought the day after the pattern prints and held for days, not minutes.
Help, and your money back if you want it
If you have any questions about the membership, the scanner or which brokers work best, just reply to any email from us, or write to research@thetraderslab.io.
If you take the $97 year today and don't love it, you can cancel any time with one email and ask for your money back on every month you haven't used, no arguing.
So don't wait: Claim your free month, and let's see what you catch in a whole month free, with no card on file.
CLAIM YOUR FREE ACCESS TO THE CANDLESTICK PATTERN SCANNER
- FREE 30 Day Pass (No Credit Card)
- Annual Price: $297 Per Year
- Next Page Only: $97 For 13 Months, Rate LOCKED In!!
James H
Your Friendly Neighborhood Trading Nerd
September 2026
Before you go, your free month is still here
You can try the Candlestick Pattern Scanner FREE for 30 days, with no credit card required and nothing to cancel, and this page is the only place to get it.
$297 a year FREE for 30 days